AnalyticsVerse vs. LinearB
LinearB is NOT a bad product
Yes, you read that right! We want to start by mentioning that LinearB is not a bad product at all, and its team has done a great job in marketing its product and creating content and awareness in the engineering analytics space, which is probably the reason you landed on this page. But, there are somethings we just do better.
Platform capabilities
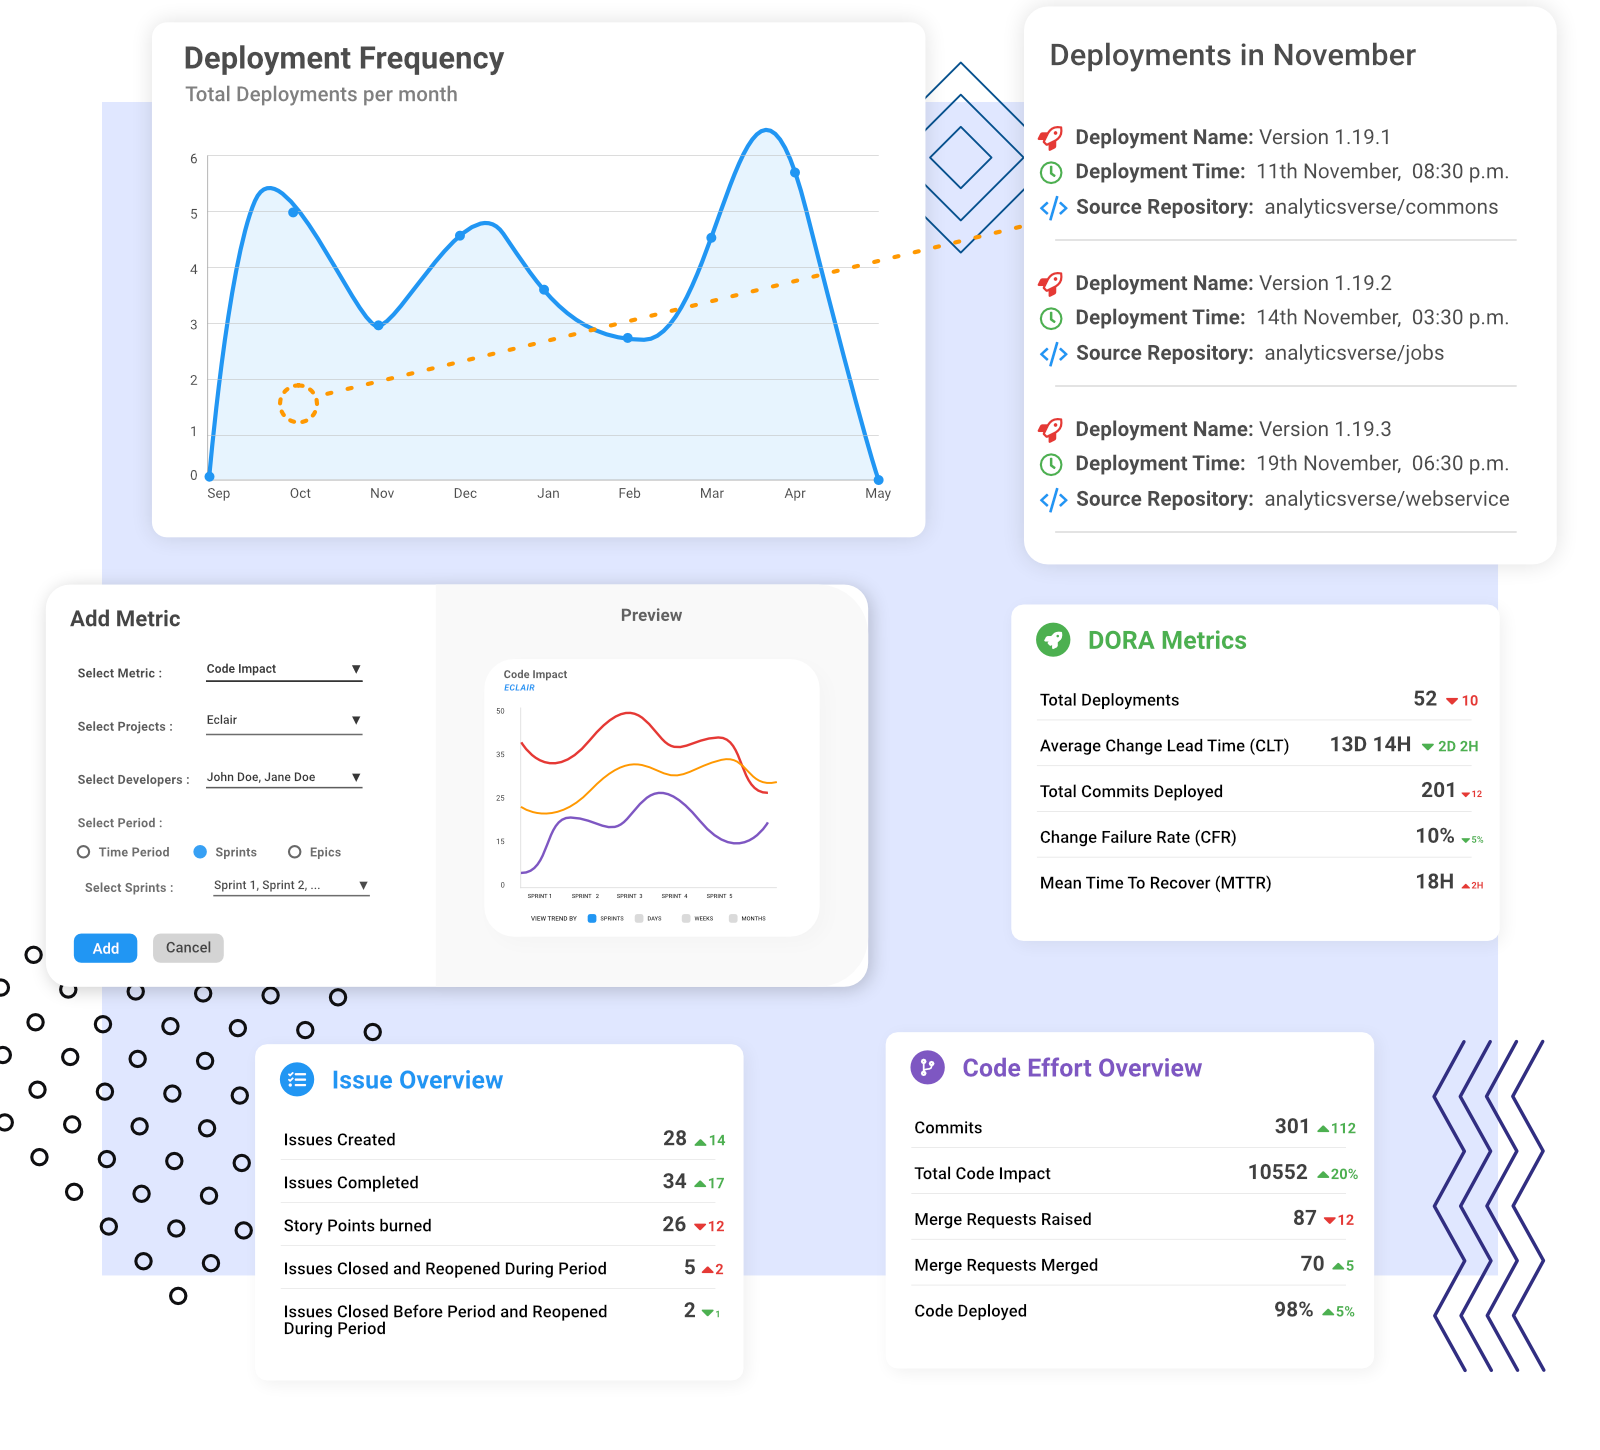
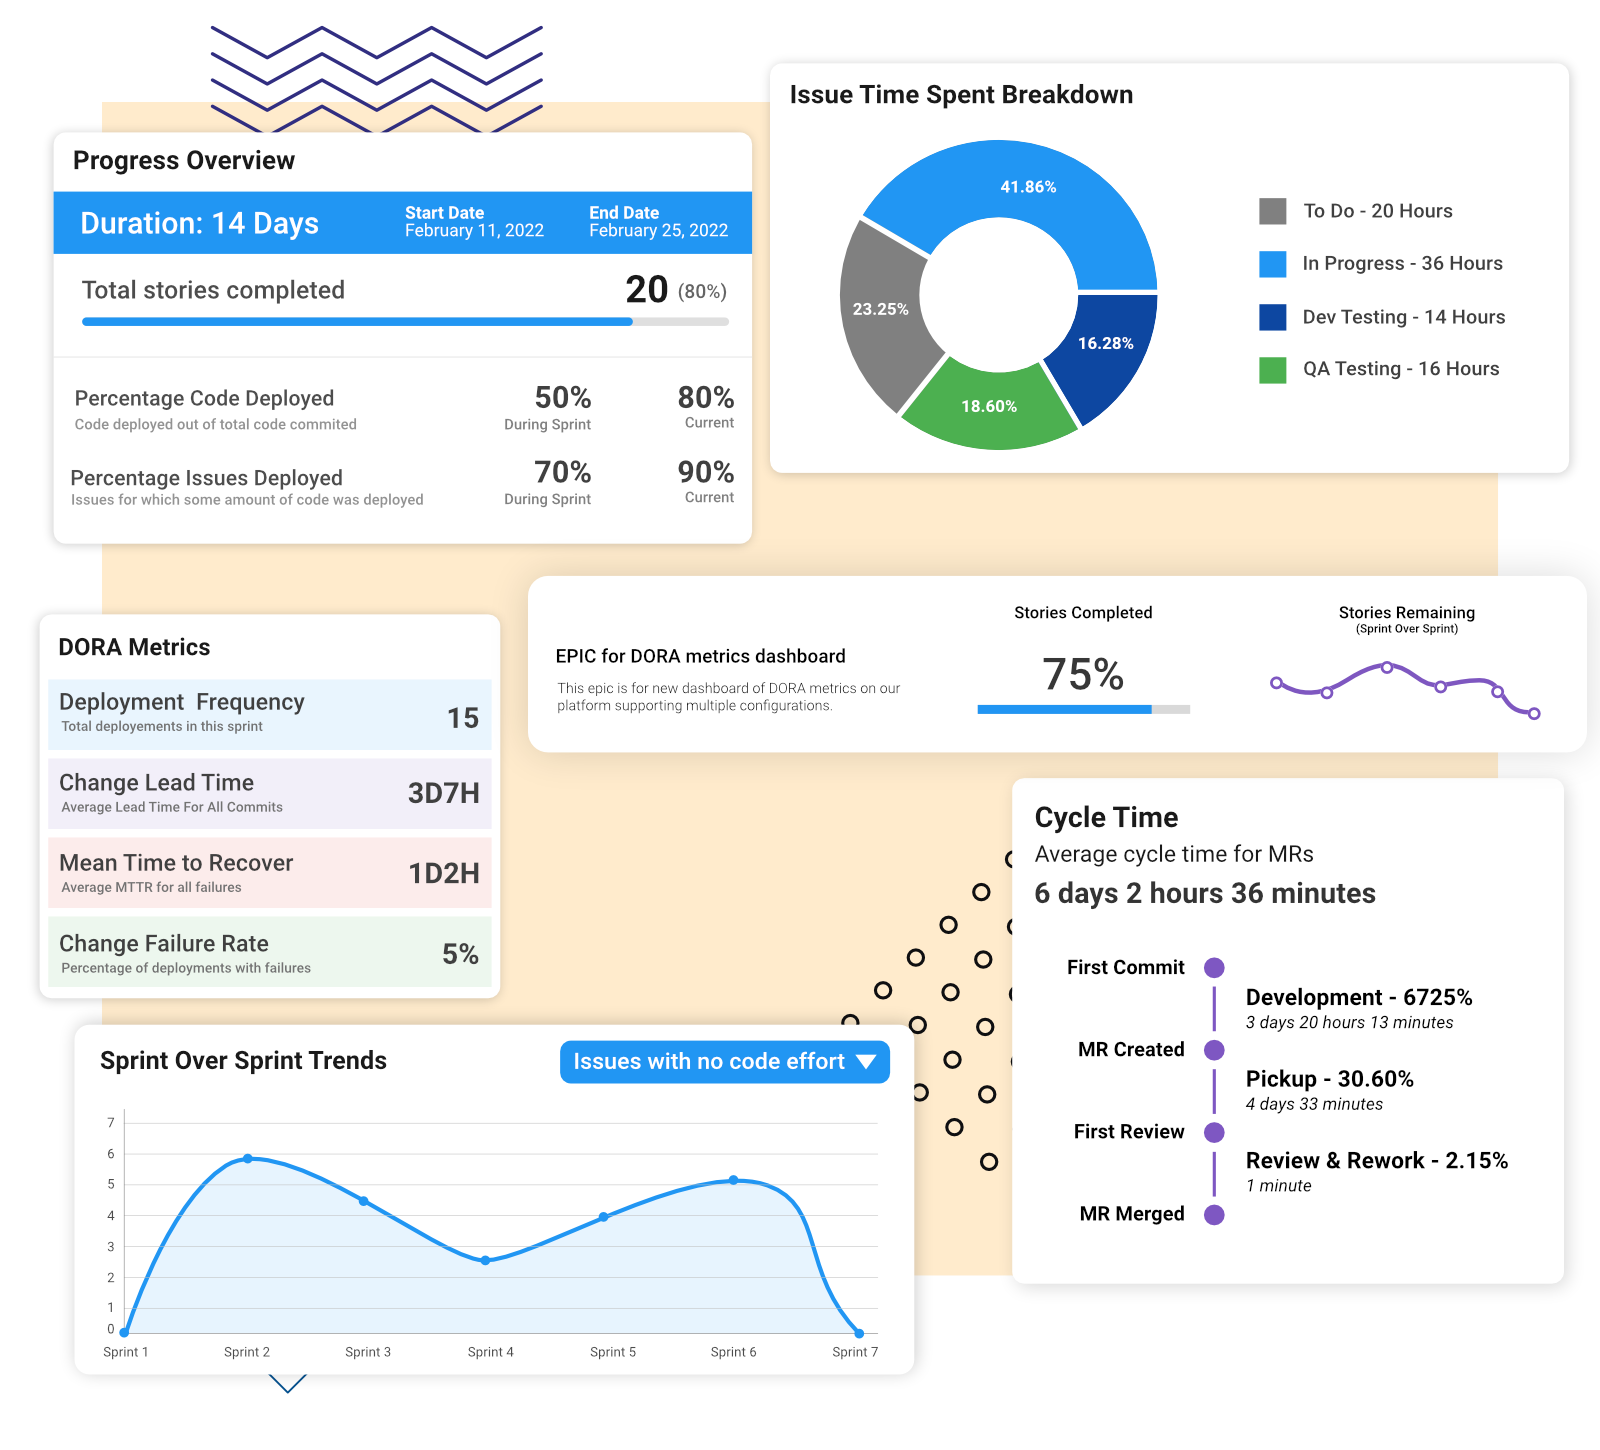
The breadth of use cases, the context, the details that make metrics actionable, and the dimensions you get on your data are much higher and better than what you would see in LinearB.
The breadth of use cases, the context, the details that make metrics actionable, and the dimensions you get on your data are much higher and better than what you would see in LinearB.
Pricing and ROI
A better product at a much better price point is what makes us the best alternative to LinearB. LinearB is 2x more expensive than AnalyticsVerse. Our monthly price starts at $14 per dev per month.
A better product at a much better price point is what makes us the best alternative to LinearB. LinearB is 2x more expensive than AnalyticsVerse. Our monthly price starts at $14 per dev per month.
Also, we have all our features in our Starter plan, unlike LinearB where half of the features are only in the business plan which is $50 per developer per month. Yes, you heard that right! $50 per developer per month.

“AnalyticsVerse gives a lot more dimensions and depth to my data than LinearB for me using which we can course correct quickly as a team.“
/01. Richness of Data and Quality of Insights
Metrics are just numbers if you don’t have a way to figure out how did you reach there and how to improve. AnalyticsVerse correlates your data across tools and gives you ways to figure out how to improve and take action much better than LinearB.


“AnalyticsVerse makes me feel more confident leading my teams and acts as the unified truth for the whole team!“
/02. True Engineering Analytics Platform
AnalyticsVerse is not a Git analytics platform. It truly helps you understand the complete lifecycle of your development processes. From planning (JIRA epics and sprints) to execution (commits, merge requests, tags, branches) to delivery (deployments, time to recovery).


“I was always skeptical about Git analytics, but after trying AnalyticsVerse I do see the value of such a platform... Brilliant!”
/03. Pricing
Our platform capabilities make us the best alternative to LinearB and I am sure you didn’t see this coming, but we have flexible monthly pricing and is half of LinearB’s price.
Don’t believe us? See for yourself.
Move the slider to select your team size and find out how much you can save with AnalyticsVerse.
 $280/month $14/mo x 20 users
 $1000/month $50/mo x 20 users
Don't Take our Word For it
Try us Out to See What We Offer
/04. Still not Convinced? Look at the differences in detail
 AnalyticsVerse AnalyticsVerse |  LinearB LinearB | |
|---|---|---|
| Cross-tool Data Linking | Best | Yes |
| Sprint, Iteration Reports | Yes | - |
| Issue Timeline View | Yes | Yes (only for current iteration in the basic plan) |
| Cycle Time Analytics | Yes | Yes |
| Daily Summary | Yes | - |
| DORA Metrics | Yes | Yes (only above business plan) |
| Detailed Drill-down | Yes | - |
| Custom Dashboards | Yes | Yes (limited functionalities) |
| Team Health Risk Indicators | Yes | Yes |
| Risks | Yes | Yes (only as filters) |
We Integrate with the tools you rely on
Trusted by 400+ high performing engineering teams


